How’s the Kitchener Waterloo Real Estate Market?
Coasting through the summer?
Kitchener rents up 25 per cent year over year.
Average rent for a two bedroom $2182.
Kitchener-Waterloo Real Estate Market Report
Brought to you by Kitchener-Waterloo Real Estate News Keith Marshall, Realtor 659 residential were sold last month. This is a decrease of 8.1% compared to August 2021 and 11.2% below the previous 5-year average for the month. Total residential sales in August included 413 detached (down 0.7% from August 2021), and 117 townhouses (down 24.0%). Sales also included 68 condominium units (down 26.1%) and 61 semi-detached homes (up 10.9%). In August, the average sale price for all residential properties in Waterloo Region was $750,849. This is a 0.4% decrease compared to August 2021 and a 0.2% decrease compared to July 2022. The average price of a detached home was $851,654. This is a 3.0% decrease from August 2021 and an increase of 1.1% compared to July 2022. The average sale price for a townhouse was $610,725. This is a 4.2% decrease from August 2021 and a decrease of 5.2% compared to July 2022. The average sale price for an apartment-style condominium was $464,959. This is an increase of 4.3% from August 2021 and a decrease of 10.9% compared to July 2022. The average sale price for a semi was $655,813. This is a decrease of 1.0% compared to August 2021 and a decrease of 0.8% compared to July 2022. There were 933 new listings added to the MLS® System in the Waterloo Region last month, an increase of 19.3% compared to August of last year, and a 1.2% increase compared to the previous ten-year average for August. The total number of homes available for sale in active status at the end of August was 1,003, an increase of 188.2% compared to August of last year, and 31.8% below the previous ten-year average of 1593 listings for August. The number of months of inventory is up 250% compared to August of last year, but still historically low. There were 1.4 months of inventory in August 2022, down from 1.8 months in July 2022. The average number of days to sell in August was 22, compared to 12 days in August 2021. The previous 5-year average is 22 days. Those requiring specific information on property values should contact a local REALTOR®. Working with a Realtor is the best way to get a complete picture of the property and community you are considering. https://wrar.ca/borrowing-costs-tame-home-sales-august/
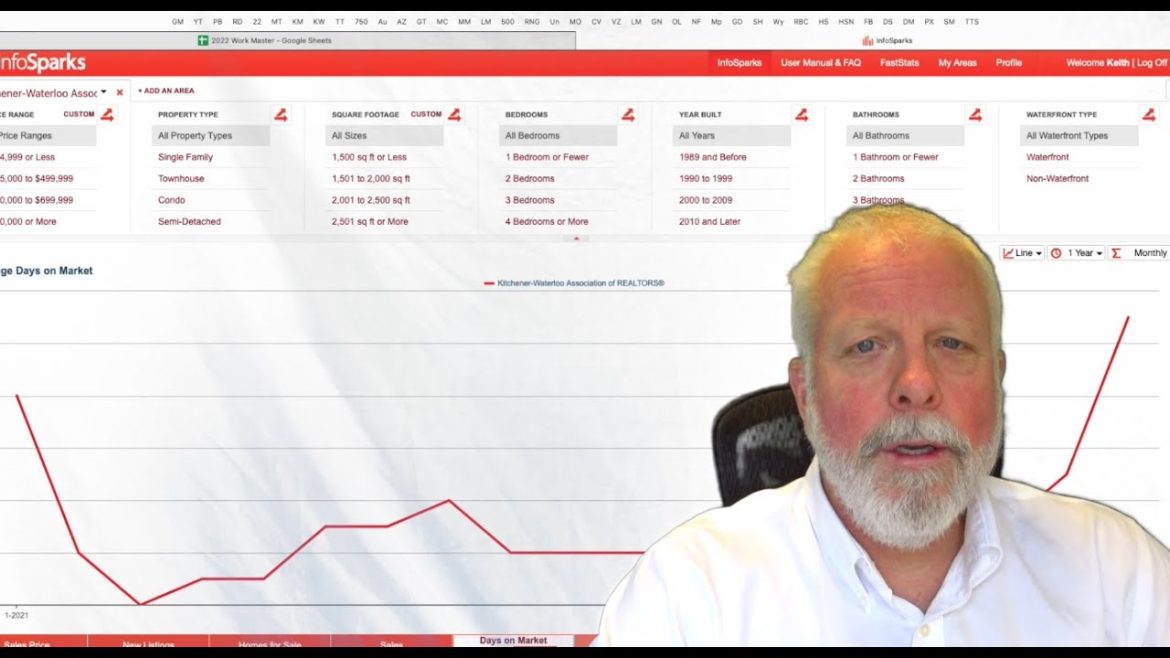
How’s the market? An updated spreadsheet video.
Summer slump or is there more to come?