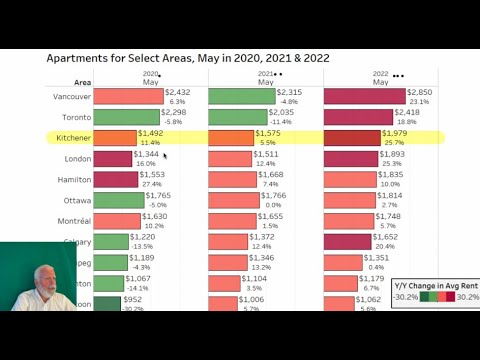
Kitchener rent prices up again Big jump in cost to rent all types and sizes of home and apartment!
How’s the Kitchener Waterloo Real Estate Market?
Kitchener Waterloo Real Estate is on track to reverse all gains by next year
Kitchener-Waterloo Real Estate Market Report
Kitchener-Waterloo Real Estate Market Report Brought to you by Kitchener-Waterloo Real Estate News Keith Marshall, Realtor 550 residential homes were sold in July. This is a decrease of 32.8% compared to July 2021, and 32.3% below the previous 5-year average for the month. Total residential sales in July included 337 detached (down 30.4% from July 2021), and 112 townhouses (down 32.9%). Sales also included 65 condominium units (down 39.3%) and 36 semi-detached homes (down 41.0%). In July, the average sale price for all residential properties in Waterloo Region was $752,301. This is a 1.2% decrease over July 2021 and a 4.9% decrease compared to June 2022. The average price of a detached home was $842,241. This is a 6.0% decrease from July 2021 and a decrease of 7.0% compared to June 2022. The average sale price for a townhouse was $642,750. This is a 3.6% increase from July 2021 and a decrease of 3.3% compared to June 2022. The average sale price for an apartment-style condominium was $521,731. This is an increase of 20.4% from July 2021 and an increase of 4.1% compared to June 2022. The average sale price for a semi was $661,087. This is an increase of 1.0% compared to July 2021 and a decrease of 5.4% compared to June 2022. There were 1,174 new listings added to the MLS® System in the Waterloo Region last month, an increase of 34.0% compared to July of last year, and a 9.2% increase compared to the previous ten-year average for July. The total number of homes available for sale in active status at the end of July was 1,283, an increase of 215.2% compared to July of last year, and 19.5% below the previous ten-year average of 1593 listings for July. The number of months of inventory was 1.7 months in July, as it was in June. While this is still at historic lows, the last time it was near this range was September of 2019 when it was 1.6 months. The average number of days to sell in July was 18, compared to 11 days in July 2021. The previous 5-year average is 17 days. Source: https://wrar.ca/home-sales-slow-down-july/


